In short
- Starting yields predict Treasury returns, most tightly when your holding period is close to the maturity.
- Split the yield into a real yield and expected inflation, and it’s the real part that does the predicting.
- A higher starting yield comes with a higher worst-case return and a smaller chance of a loss, alongside the higher average.
- As of end-May 2026, all four Treasury buckets sit in the top fifth of their own history since 2003 pointing to the favourable end on both return and risk.
When is a good time to buy Treasuries?
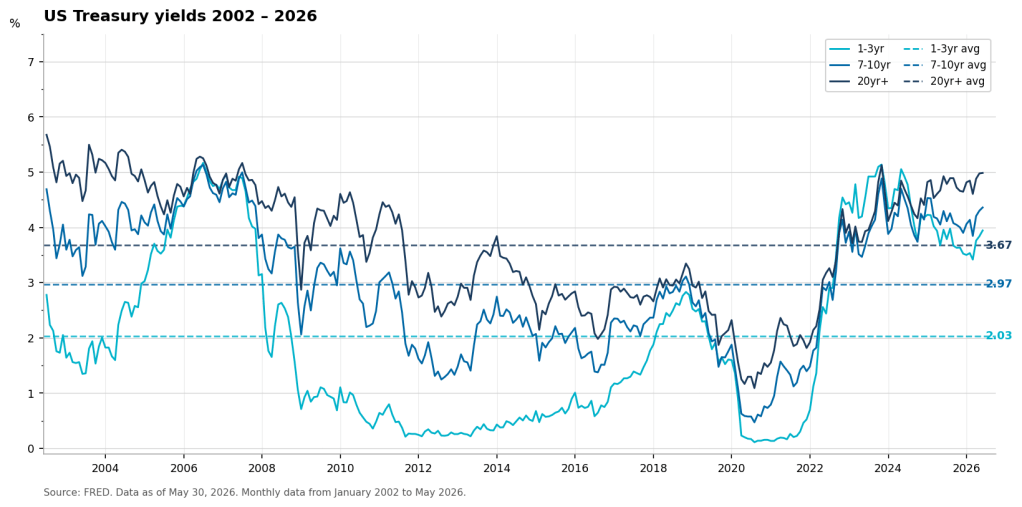
Since the pandemic, Treasury yields have covered an enormous range. The 1-year yield sat near zero through 2021, then climbed above 5% by 2023, its highest since just before the GFC. Moves like that raise a question: when is a good time to buy Treasuries, and which yield level is actually attractive in terms of forward returns? The difference between a low and a high starting yield is bigger than it sounds. Over the past two decades, a 7–10 year Treasury ETF bought in its lowest-yield quintile returned roughly zero a year over the next five years, and lost money in almost half of those windows. Bought in its highest-yield quintile, it returned around 7% a year and never had a losing five-year window.
The idea that the yield you buy at largely sets the return you earn is not new; it has been studied for a long time and can be expressed as a simple formula. A bond’s return is its carry, plus roll-down the curve, plus the price change when yields move. The price change dominates in the short run and makes returns look random, but yields mean-revert, so it nets out over longer horizons and the starting yield dominates. This holds even for the constant-maturity ETFs most people own, which never actually mature.
That idea has been recently explored on the practitioner side. Janus Henderson showed that starting yields predict corporate-bond returns, with the link far tighter over five years than over one; Columbia Threadneedle made the broader case that the starting yield is the main driver of what a bond earns. I run the same question on US Treasuries to confirm the basic relationship as a baseline, and then explore two more questions. One is that a nominal yield is really a real yield plus expected inflation, so which part does the predicting. The other is that I look at the bad cases, where a higher starting yield turns out to shrink the losses. Then I use the framework on today’s yields – still well above their 2021 lows – and ask what they imply for returns from here.
Does the starting yield predict the return?
I proxy the constant-maturity Treasury buckets with four iShares ETFs: SHY (1–3 year), IEI (3–7 year), IEF (7–10 year) and TLT (20 year and over). Their total returns, taken from month-end adjusted closing prices. For each fund’s starting yield I use the matching constant-maturity Treasury yield from the FRED website – the 2-, 5-, 10- and 20-year – as a month-end snapshot on the same dates. The sample begins at each fund’s inception (July 2002 for SHY, IEF and TLT; January 2007 for IEI) and runs through mid-2026. From the monthly series I compute annualised total returns over one to ten years and match each to the yield that preceded it.
One limitation runs through everything below. Multi-year returns, measured monthly, are heavily overlapping: a five-year window beginning in January shares all but one month with the window beginning in February. So while I have a few hundred monthly observations, there’s only a handful of genuinely independent multi-year windows. Throughout I use standard errors that allow for the overlap, and treat any figure backed by few independent windows as merely suggestive.
| Fund | 1y | 2y | 3y | 5y | 7y | 10y |
|---|---|---|---|---|---|---|
| SHY | 0.79 | 0.93 | 0.92 | 0.74 | 0.72 | 0.66 |
| IEI | 0.59 | 0.76 | 0.8 | 0.73 | 0.7 | 0.84 |
| IEF | 0.49 | 0.68 | 0.77 | 0.86 | 0.87 | 0.9 |
| TLT | 0.32 | 0.5 | 0.6 | 0.73 | 0.74 | 0.87 |
A clear pattern emerges from the table: the starting yield tracks the eventual return most closely when the holding period is near the fund’s maturity. For the short fund (SHY) correlation peaks at 2y and 3y and fades at longer horizons. For the longer funds the correlation is higher at 10y mark rather then at their maturities. The likely reason for that is few truly independent observations at 7y and 10y horizons.
Zooming in on one example, IEI, a 3–7 year ETF, correlates most strongly at ten years, not at three or five years. But a ten-year window needs a start by mid-2016, so IEI’s whole ten-year sample is trapped in 2007–2016 – less than one independent window, and lopsided: its only high yields sit in the 2007–08 patch, before the crisis pulled rates down to 1–2% for the rest of the sample. The figure is basically tracing a single rate cycle. Where the test window is wide enough to trust – 5y and under – the ordering behaves.
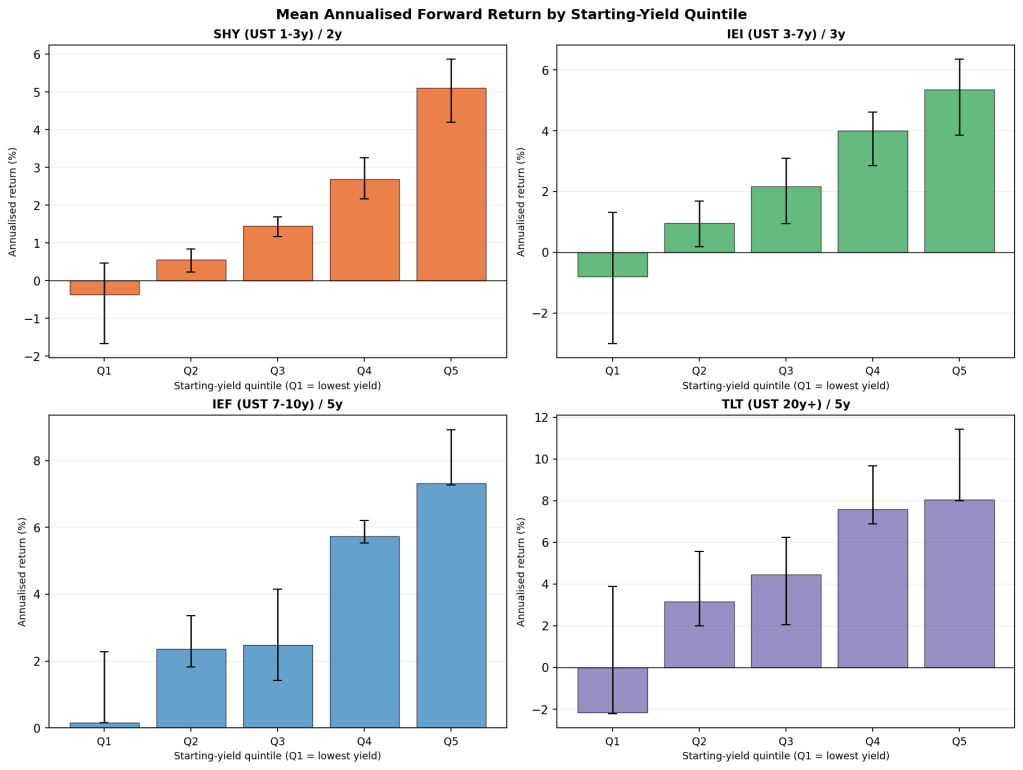
In every fund the average forward return rises from the lowest-yield bucket to the highest, step by step. The spreads are large: over five years the 7–10 year fund returned about 0% a year from its cheapest quintile and over 7% from its richest, and long bonds run from roughly −2% to +8%.
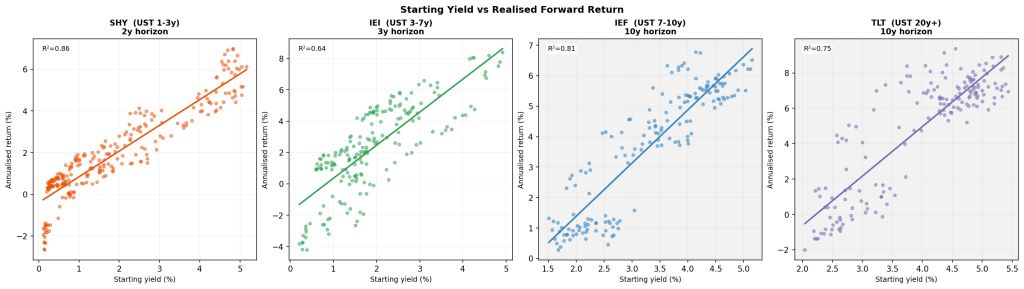
Regressing forward return on starting yield explains most of the variation – 86% for SHY at two years, and a similar 64–81% for the longer funds at their matched horizons, though those longer-horizon fits rest on only a couple of independent windows and are better read as shape than as precise numbers. The slope steepens with maturity: each extra point of starting yield adds a little over a point of annual return for the short fund and roughly three points for long bonds, because a longer fund’s price moves more for the same change in yield.
Real yield or inflation?
A nominal yield is the sum of two things: a real, inflation-adjusted yield – the inflation-adjusted and breakeven inflation, the market’s expected inflation over the life of the bond. TIPS make both identifiable. The TIPS yield is the real part, and the gap between the nominal Treasury yield and the TIPS yield is the breakeven. So I can ask which half of the yield actually carries the prediction. This needs matched real and nominal series, so I use IEI and IEF with the 5y return horizon, where the shorter sample still leaves enough independent windows to trust.
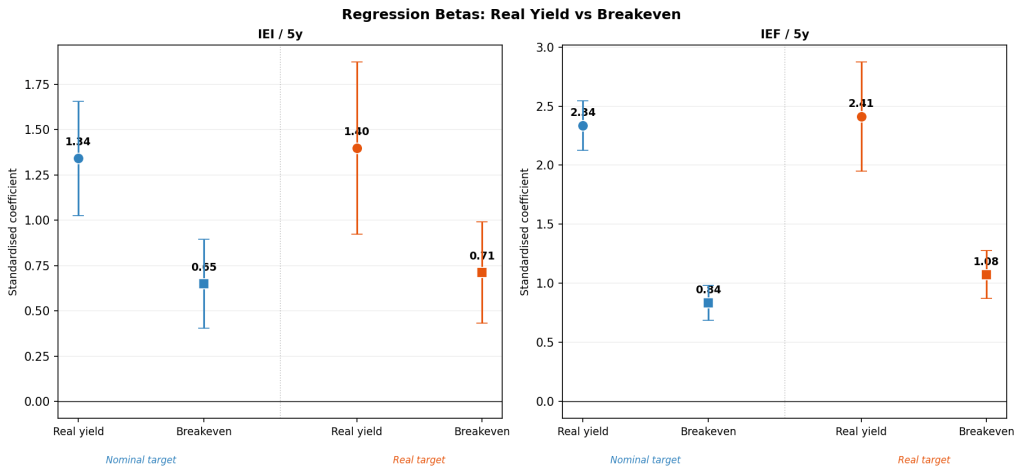
Independent variables are standartised so I can compare their coefficients directly. The real yield does almost all of the work. Its coefficients are two to three times larger than breakeven’s: a one-standard-deviation move in the real yield is worth one to two and a half percentage points of annual return, breakeven well under one.
Why? The real yield is compensation you lock in at purchase. Breakeven is only a forecast, so as a return signal the inflation half should be weaker. Another way to look at it is to switch the target from nominal returns to inflation-adjusted returns. If breakeven was pure inflation pass-through, it would help predict nominal returns but drop out of real ones. It doesn’t quite drop out – breakeven keeps a statistically significant coefficient even on real returns.
Why a higher yield is a safer one
So far this has all been about the average return you’d expect from a given starting yield. I work in market risk, so what I care about is what I can lose in the worst cases. To do that, I keep the same yield quintiles and look at the low end of each instead of the middle: the worst return the bucket produced, and how often it lost money.
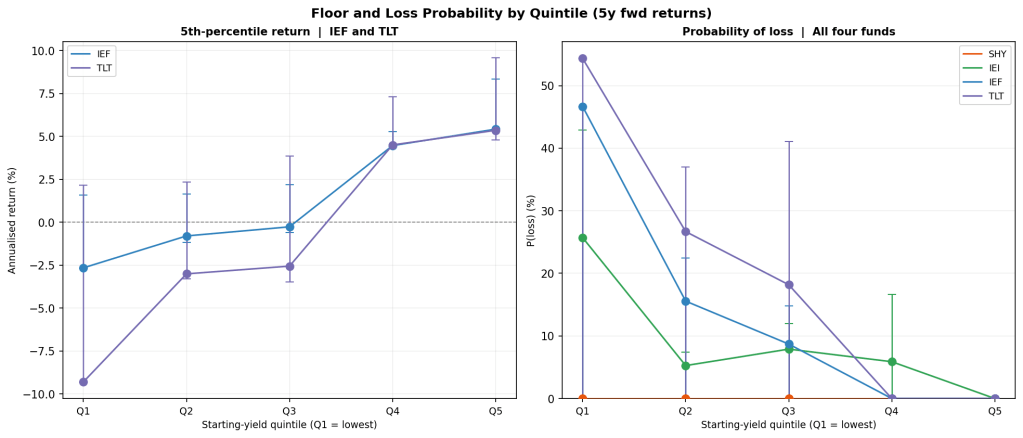
Good news is that the floor rises with the starting yield. Take the IEF over five years as an example. Bought in its lowest-yield quintile, its worst five-year observation returned about −2.5% a year, and it lost money in nearly half of all windows. Bought in its highest-yield quintile, the worst it ever did was +5% a year and it never had a losing five-year window at all. Long bonds show the same shape but a wider spread.
The probability of losing money falls just as cleanly. For the same ETF it runs near half in the lowest-yield quintile and drops to zero by the top two. Higher starting yields raise the return you expect and cut the odds of a loss.
Where that leaves us
Let’s test what the framework tells us about future returns as of end of May 2026. Every one of the four buckets is trading in the top quintile counted since 2003. Short Treasuries yield about 4%, the 7-10y around 4.5%, long bonds close to 5%. In quintile terms, all four sit in Q5, the bucket this whole post has been about.
Our analysis says that it’s a good start. Bought in its top-yield quintile, the IEF fund should return about 7% a year over the following five years, with a worst case of +5%; long bonds would return around 8% with a floor of +4.5%; from SHY we should expect about 4% a year without any chance of overall losses.
Obviously, none of this is a promise, and certainly not investment advice (!!!). Twenty years of data on autocorrelated, slow-moving series affected by long business cycles isn’t enough to claim these results with certainty. But I lean on the direction rather than the exact numbers, and it points to favourable odds for these ETFs as the real yield, the part that matters most, positive rather than negative.
 In Search of Lost Alpha
Leave a comment