Key takeaways
- A bond index fund’s tracking error is governed less by how many securities it holds than by what the index is made of: whether its weight concentrates in a core a sample can grab, and whether its composition offers a factor structure a sample can exploit. Trackability is a question of composition, not size; cost decides how much of the index is worth holding.
- In a broad, sector-structured market most of that tracking error can be aligned away through factor exposures, sector above all, whereas in high yield 93–97% of it is an irreducible idiosyncratic floor beyond the reach of any factor alignment.
- BlackRock’s own funds bear this out. On annual tracking difference the high-yield ETF misses its index nearly twice as widely as the broad-market fund, and in 2025 it closed at a premium to net asset value on 222 of 250 trading days. A persistent premium is what you’d expect from a wrapper manufacturing daily liquidity out of a market that has little of its own.
The wrong intuition
Ask which is harder to replicate by holding only a fraction of its bonds – a high-yield fund of around 1,900 bonds, or a broad-market fund of around 18,000 – and the obvious answer, that the bigger and more sprawling portfolio is more difficult to track, would be wrong! On a fractional basis, the high-yield index is the harder one to replicate. The size of the stack turns out to be a poor guide to how hard it is to match. What matters is what it’s made of.
The intuition to equate more holdings with more difficulty is understandable, because that’s how equity indexing works: most stock index funds hold every constituent at its market weight, and full replication is cheap because equities trade continuously on exchanges and even broad indices run to a few thousand names at most. Bonds break both assumptions — a single issuer can have dozens of bonds outstanding, each with its own coupon and maturity, and the broadest indices run well into five figures, most of them trading infrequently and over the counter rather than on an exchange.
This creates an expectation that a bond portfolio that samples its benchmark rather than fully replicating it must track loosely. The iShares Core Universal USD Bond ETF (IUSB) holds almost 18,000 bonds as of 30 June 2026, and owning only a fraction of them sounds like it should leak tracking error with every bond ignored. Understanding why that expectation is sometimes wrong is the job of this post.
Vanguard put a clean frame on the answer in its research note, “A bond index fund’s balancing act: Tracking error and cost.” Successful bond index management, they argue, is a balance: align a portfolio’s key risk exposures – duration, credit quality, sector – to hold down tracking error, while minimising the transaction cost of getting there. Replicate the index perfectly and you accumulate costs in the illiquid corners of the market; ignore the risk exposures and tracking error blows up. The skill is finding the point where a subset of bonds carries a risk profile like the index even though its composition doesn’t.
That reframing is useful, but it leaves a deeper question open: why does the balance sit where it does, and does it sit in the same place for every index? I argue that it doesn’t. The trade-off between tracking error and cost is the visible price of a specific job the fund performs: turning an illiquid, OTC market into a single security that trades every second of the day. The harder that liquidity transformation, the more binding the balance. Two funds that I analyse sit near opposite ends of that spectrum: IUSB, the broad USD bond market anchored by a deep, liquid core of government and securitised paper, and USHY (the iShares Broad USD High Yield Corporate Bond ETF), the high-yield corner of that same universe. The balancing act is far tougher in the second case – it’s really a liquidity act, and the ETF wrapper is the machine that performs it.
How tightly can a sample portfolio track a benchmark?
I use a simple test to answer this question. I take a benchmark’s full holdings at month-end and build a smaller portfolio from some fraction of its bonds – 5%, 10%, and so on up to 100% – and measure how closely that sample’s return tracks the benchmark’s over the following month. I employ two methods to sample bonds. The naive way picks bonds at random and weights them by size. The risk-aligned way picks bonds so the sample’s duration, credit quality and sector mix match the benchmark’s, then weights them to keep those exposures in line. I repeat each a few hundred times at every coverage level, pool across a run of monthly windows, and record the median tracking error: the standard deviation of the sample’s return against the benchmark. Alongside this, I estimate the round-trip cost of constructing each portfolio, since tighter tracking comes at the price of buying more bonds.
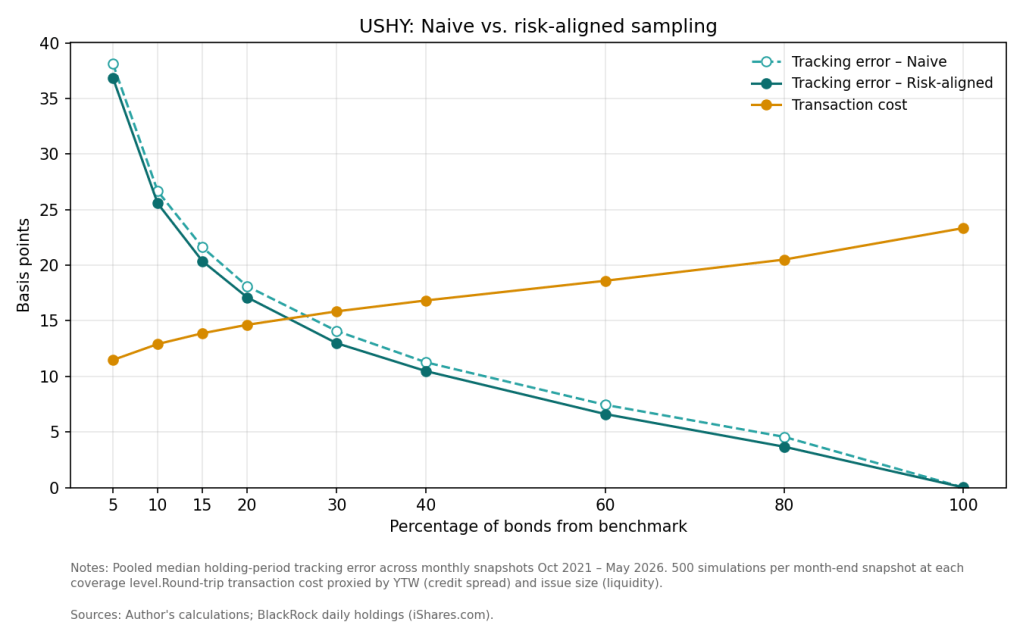
Two things stand out. First, tracking error falls as you hold more bonds – from about 37 basis points at 5% coverage down to zero at full replication. No surprise there. Second, and more telling, the two sampling methods barely differ: the risk-aligned line sits only slightly below the naive one at every point. Aligning duration, credit and sector buys you almost nothing that holding a handful more random bonds wouldn’t. Meanwhile the cost line climbs steadily, from around 11 to 23 basis points, and crosses the tracking-error line at roughly a quarter of the index.
Now run the same experiment on the broad market.
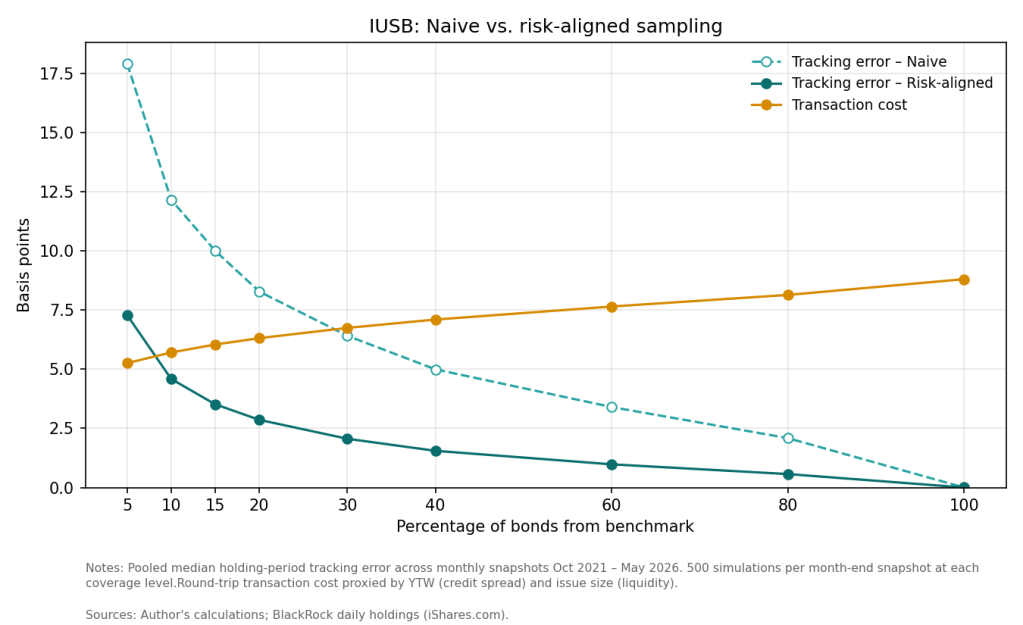
Curve shapes are similar but the numbers paint a different picture. Tracking error starts far lower – about 7 basis points for a risk-aligned 5% sample against roughly 18 for a naive one – and collapses toward zero much faster. Here risk alignment is decisive: the gap between the two methods is wide, a factor of about two and a half at low coverage, and it persists across most of the curve. Cost is lower too, barely rising from 5 to 9 basis points, and the risk-aligned tracking-error line drops beneath it by the time you hold a tenth of the index.
These figures together answer the opening question. The HY benchmark is harder to track and the optimisation barely helps. The broad benchmark is easier and cheaper to track and risk alignment helps enormously. The next two sections take that apart: first which risk factors are actually doing the work, then why the two funds sit so far apart.
Which factor is doing the work?
The risk-aligned portfolio matches three things at once: duration, sector and yield-to-worst (a proxy for credit and spread risk). I broke them apart to see how much of the improvement each delivers by itself. Next figure shows the median tracking error at 20% coverage for every variant, side by side for the two funds.
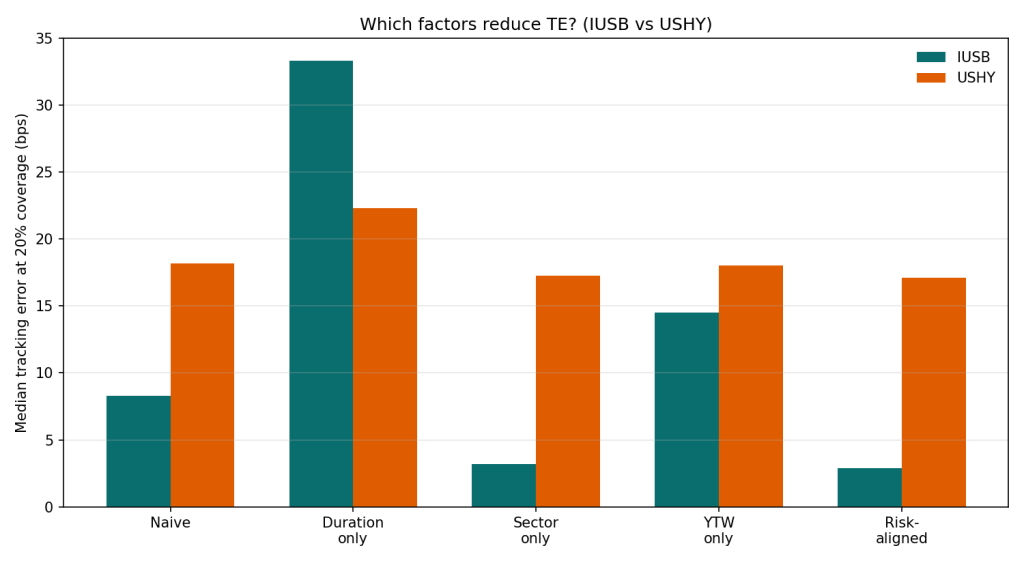
For the broad market the answer is sector. Matching sector alone drags IUSB’s tracking error from about 8 basis points to 3, essentially the whole way to full alignment. Get the mix of Treasuries, mortgages and credit right and the rest is rounding. The other two factors backfire: duration alone pushes the error above 30 basis points, yield alone to around 15. Chase a single non-sector target and the sample loads up on whatever bonds hit it, throwing it off the sector balance that actually drives returns. The deeper reason is compositional: IUSB’s risk is systematic and sector-shaped – rate-driven Treasuries and mortgages alongside spread-driven credit – so the sector mix is the exposure that matters, and duration rides along inside it. The next section puts a number on how much of each fund’s risk that structure explains.
High yield tells the opposite story: nothing works. Every variant, full alignment included, sits in the same 17-to-22 basis-point band as the naive sample. There is no factor to exploit: a high-yield bond’s return is mostly its own issuer’s story, which no amount of matching diversifies away. Only holding more names does, which is why USHY’s error stayed stubbornly high however cleverly it was sampled.
A liquid core and a long tail
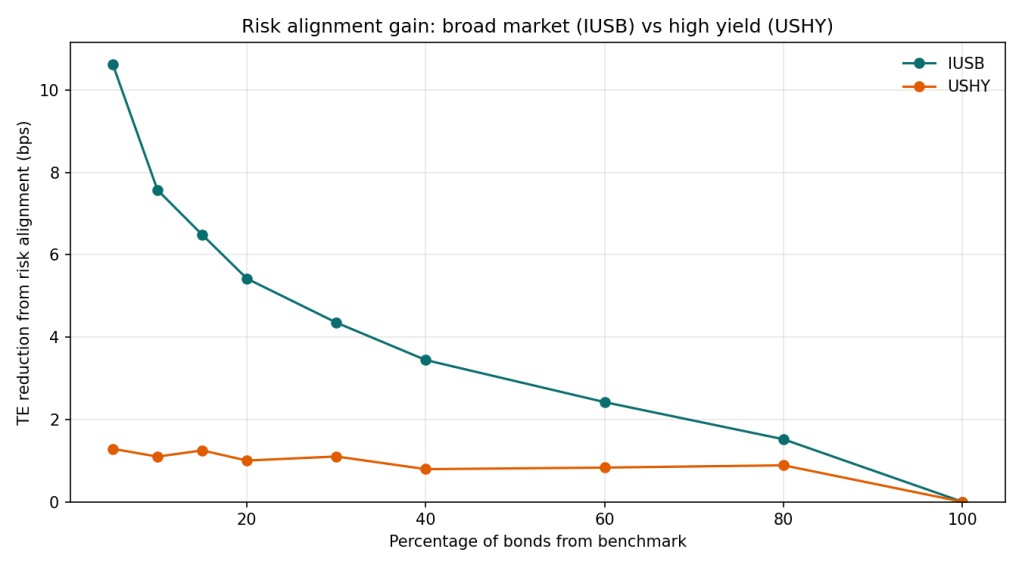
So far we have established two facts: high yield tracks worse at every coverage level, and risk-aligned optimisation doesn’t help it. Next figure puts numbers on the second point. It splits the tracking error of a naive sample into the part factor alignment can remove and the part that survives even a perfectly aligned sample: the idiosyncratic floor.
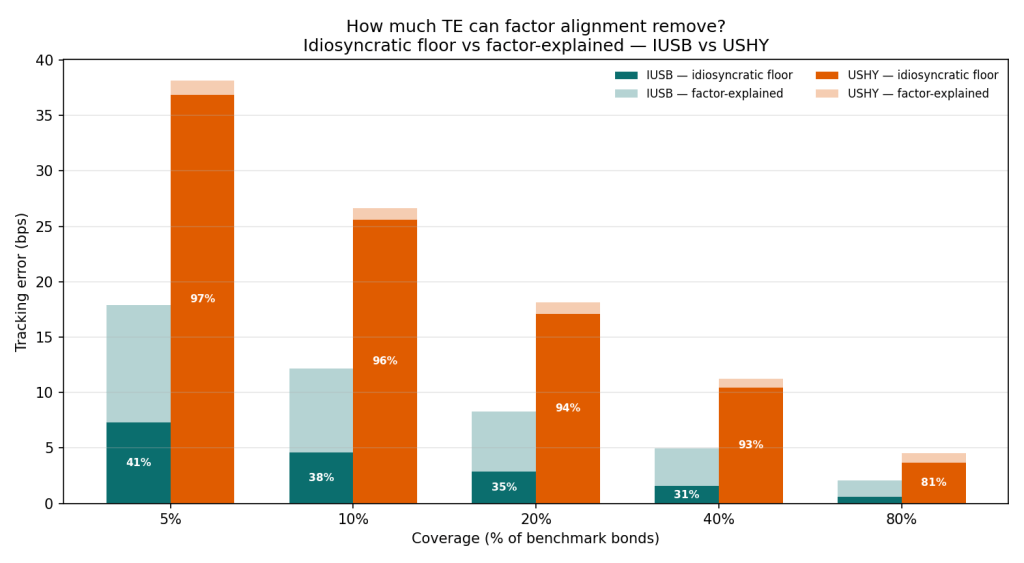
For the broad market, alignment does most of the work: only about a third of IUSB’s tracking error is floor (31–41% at coverages up to 40%), so aligning duration, sector and credit strips out the other two-thirds. For high yield the picture inverts: 93–97% of USHY’s tracking error is floor at any coverage a sampled fund would run, and even at 80% of the index the floor is still four-fifths of the error.
Why is USHY’s tracking error overwhelmingly idiosyncratic? That is a question about structure. Figure below plots each index as a composition curve: bonds ranked and accumulated along the horizontal axis, the cumulative share of index weight up the vertical. The diagonal is perfect equal-weighting; the further a curve bows above it, the more concentrated the index.
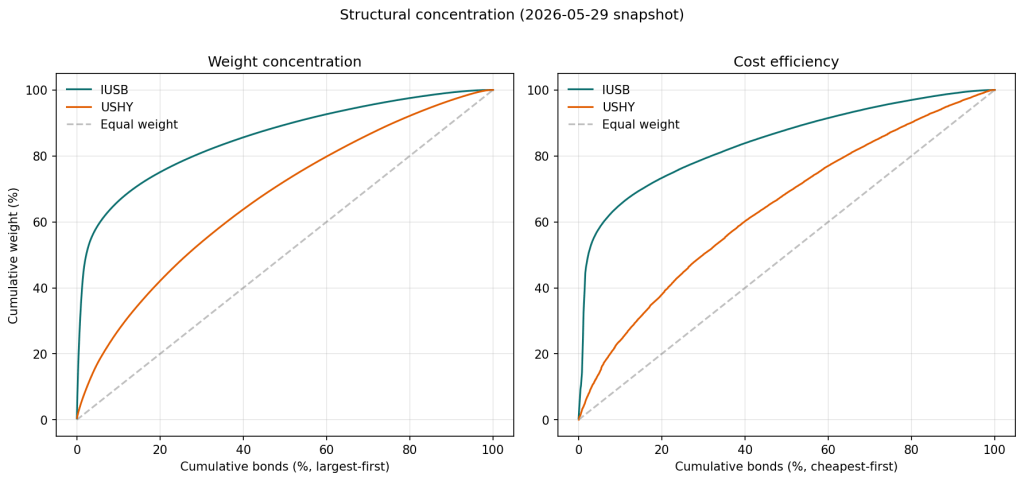
The left panel shows the primary composition difference. IUSB has a liquid core: its largest 2% of bonds carry almost half the benchmark’s weight, the top fifth three-quarters, so a sample that grabs those big, liquid names has most of the index. USHY’s curve is closer to the diagonal, and it takes half its bonds to reach 70% of the weight. There is no core to align with; the risk is spread across hundreds of issuers, so a small sample always misses a scattered chunk.
The right panel tells a similar story about cost. Three-quarters of IUSB’s weight sits in the cheapest fifth to trade, so you can build most of the exposure without touching an expensive bond. USHY’s weight spreads across the whole cost spectrum, with the cheapest fifth holding only about a third, so benchmark exposure means buying pricier, less liquid bonds.
This is the liquidity transformation in two curves: IUSB is a small, liquid core with a long thin tail, USHY is all tail. Hold IUSB’s core and you’re most of the way to the match, cheaply; high yield offers no such shortcut. That is why the balancing act, gentle for the broad market, turns brutal in high yield, and why an index with a tenth the bonds is the harder one to replicate.
The real funds and the price of liquidity
So how many bonds does a fund actually need? For the broad market, surprisingly few: a risk-aligned tenth of the index tracks more tightly than it costs to build, because the liquid core carries the load. For high yield there is no comfortable number. Error falls only with coverage, cost rises with it, and the two cross near a quarter of the index; beyond that, precision is bought at a loss.
BlackRock’s own numbers point the same way. Over 2021–2025, USHY’s realised tracking difference — the average absolute gap between the fund’s annual return and its index, a level rather than the volatility the simulations measure — ran to 15.6 basis points a year against 8.6 for IUSB: the high-yield fund tracks nearly twice as loosely, the same ordering the simulations imply. A couple of basis points can be explained by the higher expense, but the deviations move both ways, so most of it is tracking, not cost. The premium/discount data hints at the flip side. In 2025 USHY closed above NAV on 222 of 250 days and below it on just 26, versus 192 and 43 for IUSB, and with wider premiums. Part of any bond ETF’s premium is mechanical but the rest is what you’d expect when a wrapper supplies liquidity its underlying market lacks: investors pay extra for an escape from the balancing act itself.

Leave a comment